


As companies strive to ensure flawless operations, bolster security measures, and optimize performance, there has been a notable surge in demand for state-of-the-art server management tools.
In 2020, a quarter of global companies indicated that their servers incurred an average hourly downtime cost ranging from $301,000 to $400,000 USD. This staggering statistic underscores how organizations recognize the importance of maintaining high-performing servers. Such efforts are aimed not only at ensuring uninterrupted services and enhanced user experiences but also at safeguarding sensitive data.
This guide presents six top-tier solutions for server management. These particular tools have been singled out due to their well-established capabilities in effectively tackling the diverse spectrum of challenges that modern enterprise servers are confronted with.
- ManageEngine: Best for deep server visibility (Read more)
- Site24x7: Best for centralized monitoring (Read more)
- Plesk: Best for commercial web hosting management (Read more)
- Pulseway: Best for remote monitoring and management (Read more)
- cPanel: Best for end user web hosting management (Read more)
- NinjaOne: Best for simplifying server management (Read more)
- Top server management software comparison
- ManageEngine
- Site24x7
- Plesk
- Pulseway
- cPanel
- NinjaOne
- Key features of server management software
- How to choose the best server management software for your business
- How we evaluated server management software
- Frequently Asked Questions (FAQs)
- Bottom line: Choosing the best server management software for your business
Top server management software comparison
The table below presents a head-to-head comparison to assist businesses in making informed decisions when selecting the most suitable software for their specific server management needs.
| Server monitoring | Security management | Remote access | Patch management | Starting price | |
|---|---|---|---|---|---|
| ManageEngine | Yes | Yes | Yes | No | Approx. $245 for 25 devices |
| Site24x7 | Yes | Yes | No | No | $9/mo. for 10 basic monitors and networking analyzing tools |
| Plesk | Yes | Yes | Yes | No | $12.38/mo. for the Web Admin Edition (VPS) |
| Pulseway | Yes | Yes | Yes | Yes | $22/mo. for 20 endpoints |
| cPanel | Yes | Yes | Yes | No | $15/mo. for cPanel Solo (one hosting account) |
| NinjaOne | Yes | Yes | Yes | Yes | Contact sales for quote |
Jump to:
- Key features of server management software
- Benefits of working with server management software
- How do I choose the best server management software for my business?
- How we evaluated server management software
- Frequently Asked Questions (FAQ)
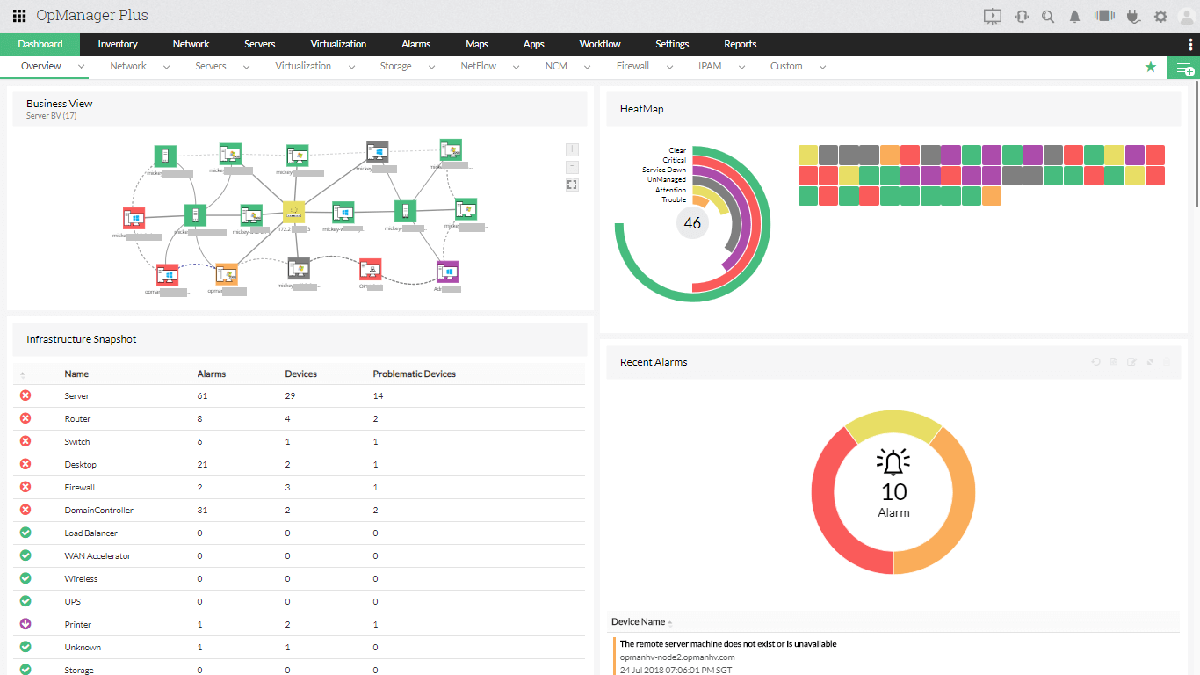
ManageEngine
Best for deep server visibility
ManageEngine, a flexible software for handling IT operations and services, provides complete solutions for tasks like managing services, operations, Active Directory, security needs, and servers.
It deals with a wide range of challenges in IT management, giving users the power to control digital identities, automate how services are provided, keep an eye on network servers and apps, and improve cybersecurity. It even offers tools for managing HR services and enterprise help desks.
Pricing
- Pricing depends on the ManageEngine products and the number of users.
- For example, ManageEngine OpManager starts at $245 for 25 devices.
Features
- Server monitoring: Monitor the availability, health, uptime, and performance of diverse virtual server environments including Windows, Linux, VMware, and more.
- Windows server management: Maintain and manage Windows servers effectively, minimizing downtime.
- Patch management: Automate OS and third-party patch deployment to safeguard Windows and Mac systems from security vulnerabilities.
- Software deployment: Streamline software distribution, making software installation and uninstallation hassle-free.
- IT asset management: Monitor and manage IT assets, spanning hardware and software, for compliance and efficient resource utilization.
Pros
- Diverse IT management solutions catering to businesses of all sizes.
- HR service management tools for streamlined HR processes and increased productivity.
- Availability of free versions of select products with limited features.
Cons
- Certain products might incur higher costs for larger businesses.
- Interface complexity could overwhelm new users.
For more information, read the full ManageEngine review.
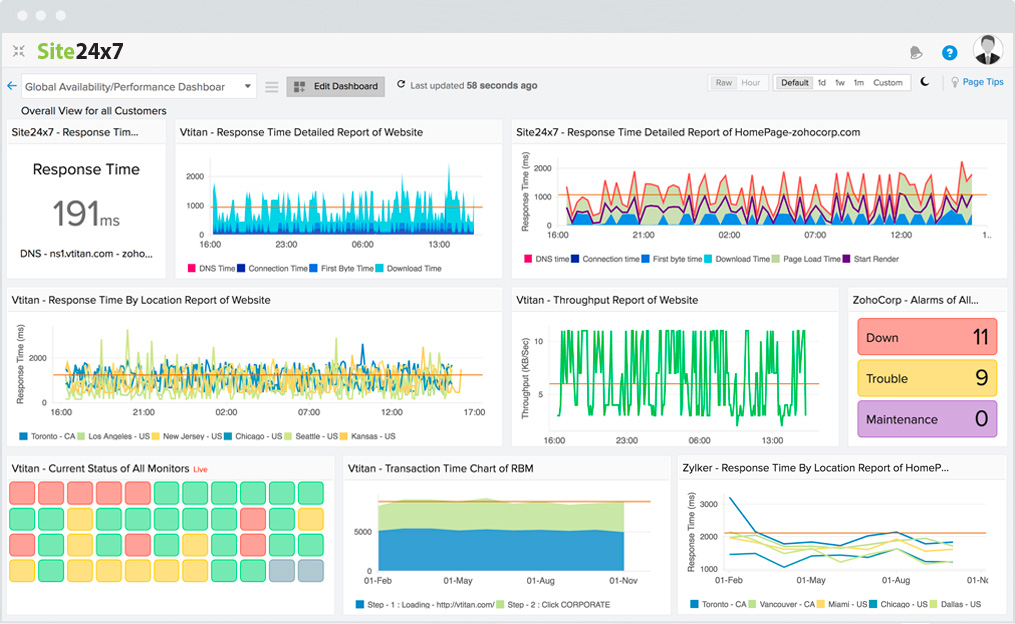
Site24x7
Best for centralized monitoring
Site24x7 is a cloud-based monitoring software designed to ensure websites, servers, networks, and applications maintain uptime and performance. With its user-friendly interface, scalability, and affordability, it’s a preferred choice for businesses of all sizes.
Comprising website, server, and network monitoring, along with application performance tracking, Site24x7’s comprehensive features empower businesses to proactively manage digital environments and optimize user experiences.
Pricing
- Site24x7 provides a variety of pricing plans catering to businesses of all sizes and requirements.
- Pricing begins at $9 per month for a Starter plan which includes up to 10 basic monitors, network monitoring tools, 500MB logs, and more.
- Pricing scales up to $225 per month for custom plans designed for high volume requirements.
Features
- Website monitoring: Keep tabs on website availability and performance across 120+ global locations and private networks. Utilize keyword scans, and set up notifications via voice calls, emails, SMS, and more.
- Server monitoring: Monitor a range of servers and cloud-hosted applications such as Windows, Linux, VMware, AWS, and Azure for optimal performance. Employ root cause analysis to swiftly identify and address server issues.
- Network monitoring: Ensure network devices, interfaces, and protocols maintain peak performance and uptime.
- Application performance monitoring: Equip DevOps and SysAdmin teams with dashboards and alerts for timely decision-making.
- End-user experience monitoring: Gain in-depth performance insights and facilitate issue resolution.
Pros
- User-friendly interface and simple setup process.
- Offers a wide array of comprehensive monitoring tools.
- Scalable and customizable to suit varying needs.
- Affordable pricing plans tailored to different budgets.
Cons
- Certain users have encountered challenges with customer support.
- Integration options with third-party tools are somewhat limited.
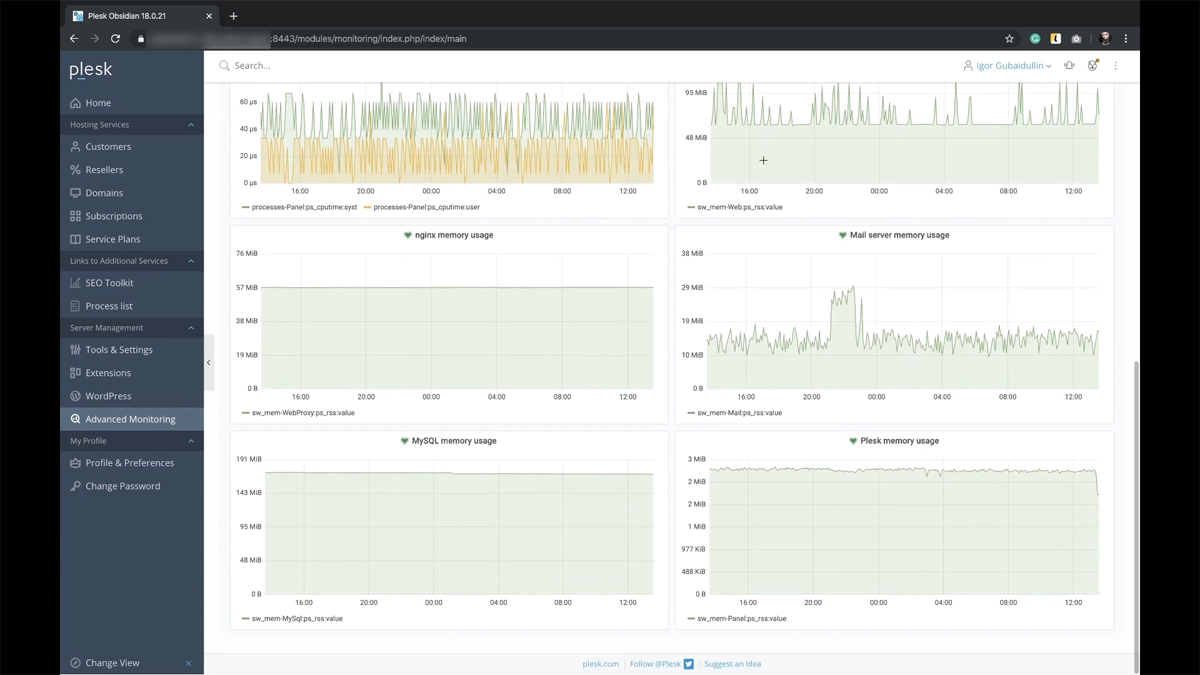
Plesk
Best for commercial web hosting management
Plesk, a web-based control panel, streamlines website management through an intuitive graphical user interface. Available on both Windows and Linux servers, Plesk enables users to effortlessly oversee hosted services like websites, databases, and emails.
Compatible with operating systems like Windows, Debian, and CentOS, Plesk offers a centralized control panel with automation tools to optimize website and email server management, saving time and increasing efficiency. Its features include user-friendliness, clear information display, and efficient management of multiple client websites.
Pricing
- Web Admin Edition: $12.38/month
- Web Pro Edition: $18.79/month
- Web Host Edition: $16.50/month
- Plesk Partners Business Plans: $250
Features
- User-friendly interface: Plesk’s intuitive graphical user interface (GUI) simplifies website management tasks, catering to users of all expertise levels with its structured and accessible web interface.
- Website management: Manage websites with ease, covering tasks like file creation, domain management, and DNS configuration. The built-in file management negates the need for separate FTP clients.
- Database management: It equips users with tools for seamless database management, facilitating the creation, modification, and backup of databases. Popular systems such as MySQL and PostgreSQL are supported.
- Email management: Effortlessly handle email accounts, forwarding, and spam filters through Plesk. It supports common protocols like POP3, IMAP, and SMTP.
- Security: Plesk offers robust security features including SSL/TLS certificates, firewalls, and antivirus protection. These safeguards shield websites and servers from potential threats and vulnerabilities.
Pros
- Intuitive GUI simplifies website, domain, and email management tasks.
- Automation tools to enhance efficiency and save time in website and server management.
- Serves as a central hub, enabling management of multiple websites and services from one interface.
Cons
- Pricing is comparatively higher than other web hosting control panels.
- The unique interface might require adjustment for users accustomed to other control panels like cPanel.
Pulseway
Best for remote monitoring and management
Pulseway, a top remote management software, is trusted by 3600 IT departments and MSPs worldwide. It offers features like remote monitoring, automation, patching, and control, and its mobile app allows real-time network management on smartphones or tablets for quick responses.
An easy-to-use interface and simple deployment make it accessible for IT experts and newcomers. Pulseway’s versatility in network monitoring provides a holistic view of infrastructure, preferred for remote management across sectors.
Pricing
- Pulseway’s RMM product is priced per endpoint and follows a tiered pricing structure, offering varying discount levels based on the number of endpoints.
- Pricing starts at $22 per month for 20 endpoints.
Features
- Automation: Streamline operations by enabling automated tasks like patching and maintenance, leading to reduced downtime and enhanced efficiency.
- Patch management: Ensure automatic updates for both OS and an extensive array of third party applications.
- Remote control: Comprehensive coverage for both Windows and macOS, serving as an all-in-one remote monitoring and management solution.
- Network discovery: Utilizing Pulseway’s network discovery feature provides an encompassing perspective of your network, offering operational insights for workstations, servers, VMs, network devices, and more.
- Mobile app: Pulseway’s mobile app empowers users to oversee network activities in real-time via smartphones or tablets, enhancing flexibility and responsiveness.
Pros
- Use Pulseway’s mobile app to monitor and manage your network in real-time via smartphones or tablets.
- Comes with an intuitive interface and an easy deployment process, ensuring user-friendliness.
- Pulseway Remote Control serves as an all-in-one remote monitoring and management solution for both Windows and macOS.
Cons
- Limited integrations with other platforms and tools.
- Limited options for customizations.
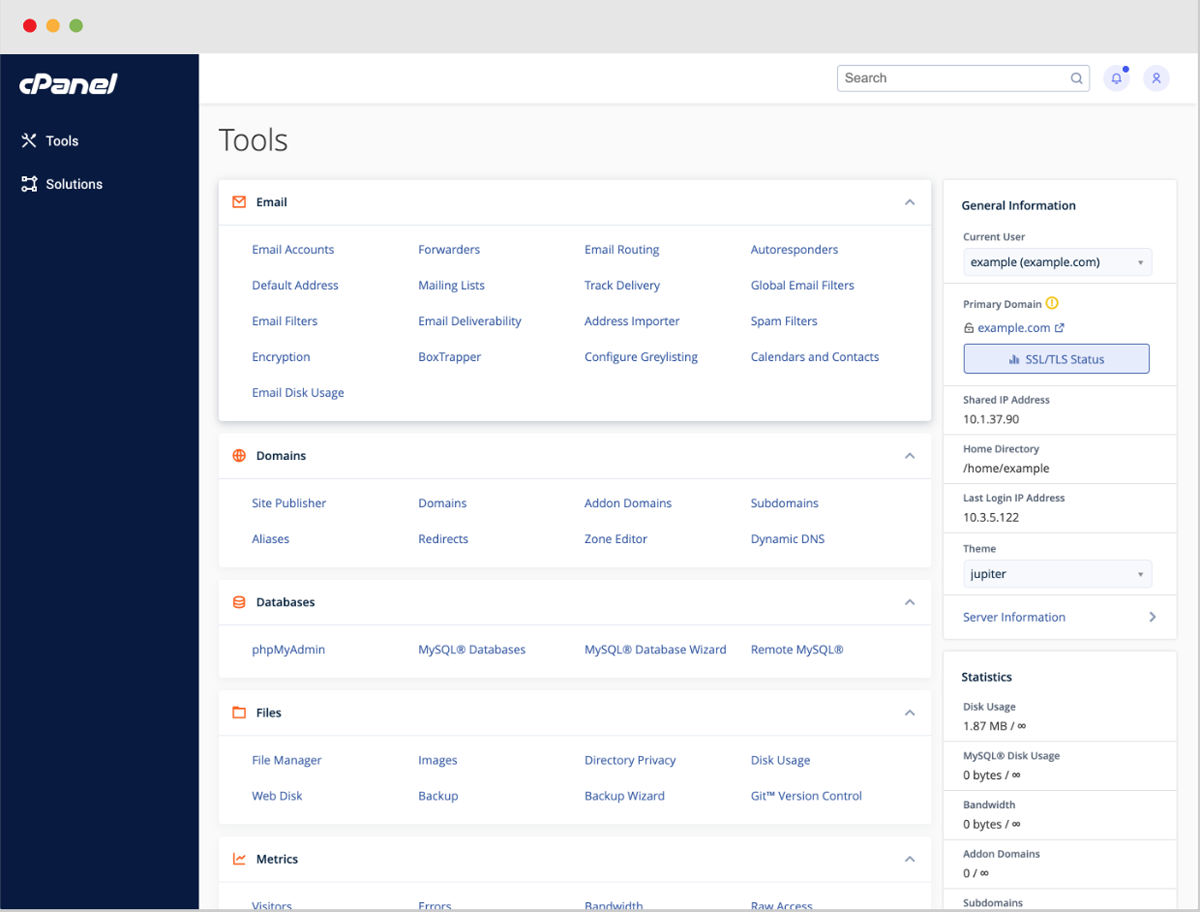
cPanel
Best for end user web hosting management
cPanel provides a GUI and automation tools, simplifying website hosting for users and owners. As a Linux-based control panel, it streamlines server administration, offering user-friendly front-ends for tasks like email, database, and file management.
Acting as a user interface, cPanel makes complex systems manageable for developers and regular users. Many popular web hosts use cPanel, so leveraging its functionality improves your hosting experience.
Pricing
- Solo: $27.99/month
- Admin: $37.99/month
- Pro: $49.99/month
- Premier: $74.99/month
- Partner pricing: Apply to be a cPanel partner and get discounts, extra support, and certifications.
Features
- Backup/restoration: Built-in backup and restoration feature, simplifying the creation of backups for website files, databases, and email accounts. This ensures data can be restored if issues or data loss occur.
- Security center: Comes with tools like SSL/TLS management, IP address blocking, password protection, and virus scanning to bolster website security.
- File management: User-friendly file manager facilitates easy file upload, download, and management for websites. It supports file editing, permissions control, and compression for efficient handling of website files.
- DNS Zone Manager: Easy addition, editing, or deletion of DNS records like A, CNAME, MX, and TXT records doesn’t require technical expertise.
- Service configuration: Manage server settings using an intuitive interface. Customize PHP settings, manage cron jobs, configure email routing, and more, tailoring the hosting environment to specific needs.
Pros
- Its GUI simplifies website and hosting management for users.
- Includes a built-in backup and restoration feature, making it easy to create backups of website files, databases, and emails.
- Boosts website security with SSL/TLS management, IP address blocking, password protection, and virus scanning.
Cons
- cPanel’s proprietary nature limits customization possibilities, posing challenges for advanced DNS and database management.
- Setting up cPanel requires a fresh install of the operating system, which can be time-consuming and complex.
Also see our list of popular cPanel alternatives.
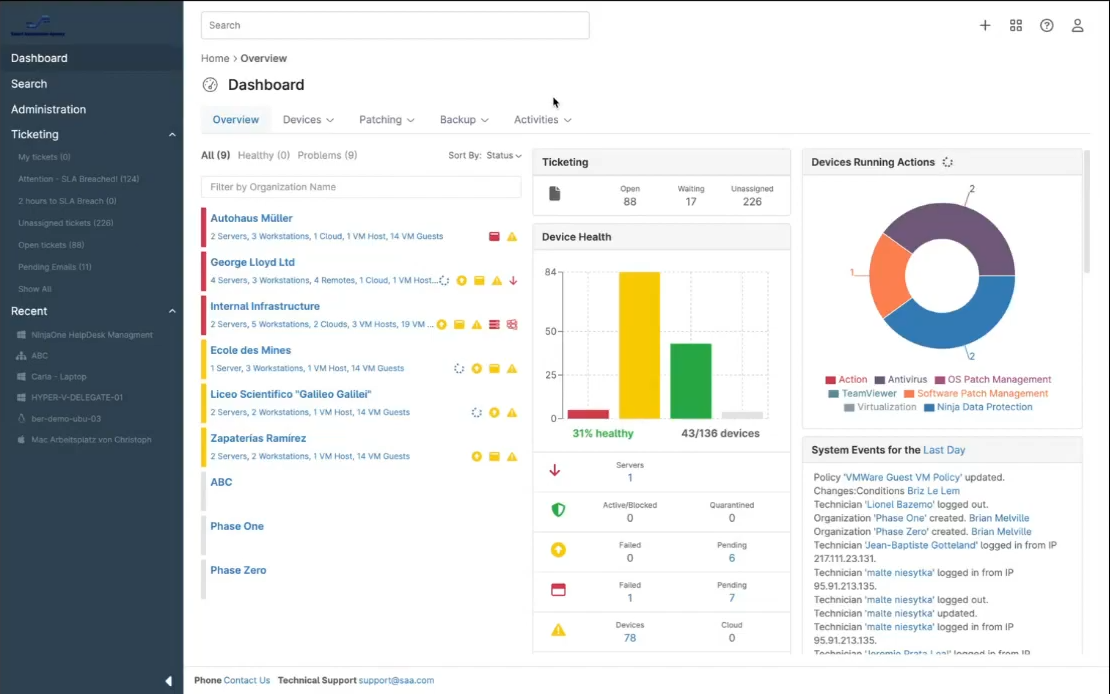
NinjaOne
Best for simplifying server management
NinjaOne is an IT management platform for easy endpoint monitoring and management via a lightweight agent. This agent helps devices and the platform exchange data for analysis and execution. NinjaOne’s modern UI blends monitoring, management, patching, backup, and automation to boost IT service and technician efficiency. It also enforces strong security controls against unauthorized access and malicious actions.
Pricing
- NinjaOne offers a pay-per-device pricing structure that allows you to customize the solution based on your needs.
- You need to contact a NinjaOne sales representative to get a quote.
Features
- Monitoring: Facilitates endpoint monitoring through a lightweight agent application on devices, enabling data transmission for analysis and execution between devices and the platform.
- Management: Comprehensive IT management software, integrating potent monitoring, patching, backup, and automation features with a modern UI to enhance technician efficiency and IT service delivery.
- Automation: Automation capabilities to streamline tasks, boosting efficiency for IT teams.
- Endpoint security: Enforces security controls for authentication, authorization, and access, effectively preventing malicious activities.
- Asset management: Endpoint management extends to asset tracking and management of hardware and software components by IT teams.
Pros
- Integrated IT management platform, encompassing robust monitoring, management, patching, backup, and automation features.
- Superb patch management catering to both remote and on-premise devices.
- Provides unlimited onboarding support at no extra charge, allowing customers to swiftly onboard within days, not weeks or months.
Cons
- Some users have suggested enhancing the reporting functionality.
- The NinjaOne distribution server heavily relies on an active directory.
Key features of server management software
There are several vital components that make up exceptional server management software. From robust monitoring capabilities to streamlined patch management, here are the key features that empower businesses to maintain optimal server performance and enhance overall operations.
Server monitoring
Effective server monitoring forms the core of successful server management. This feature constantly checks server health, resource use, and availability. By swiftly spotting anomalies, businesses can proactively address issues before they escalate.
Real-time monitoring ensures peak server performance, cuts downtime, and keeps operations smooth. Admins gain vital insights into server metrics, aiding informed decisions and timely optimizations.
Resource allocation
Smart resource allocation is vital in server management, directly influencing efficiency. This capability wisely assigns resources like CPU, memory, and storage based on work demands. This prevents bottlenecks and performance drops by dynamically distributing resources.
Balanced allocation ensures even workloads, boosts server stability, and maximizes responsiveness. This equals efficient performance and better user experiences.
Security management
Strong security management is crucial for safeguarding digital assets. This includes user access controls, encryption, firewall management, and vulnerability assessments. Access controls ensure only authorized personnel access sensitive data.
Encryption adds protection during transmission and storage. Firewall management enhances network security by regulating traffic. Regular vulnerability assessments find weaknesses for timely fixes. This approach fortifies data integrity, privacy, and defense against cyberthreats.
Remote access
Modern server management offers remote access, transcending distances. This lets administrators securely control servers from anywhere, aiding troubleshooting, adjustments, and updates.
Global operations benefit from reduced response times and streamlined management. Remote access boosts flexibility, letting IT teams handle tasks from anywhere.
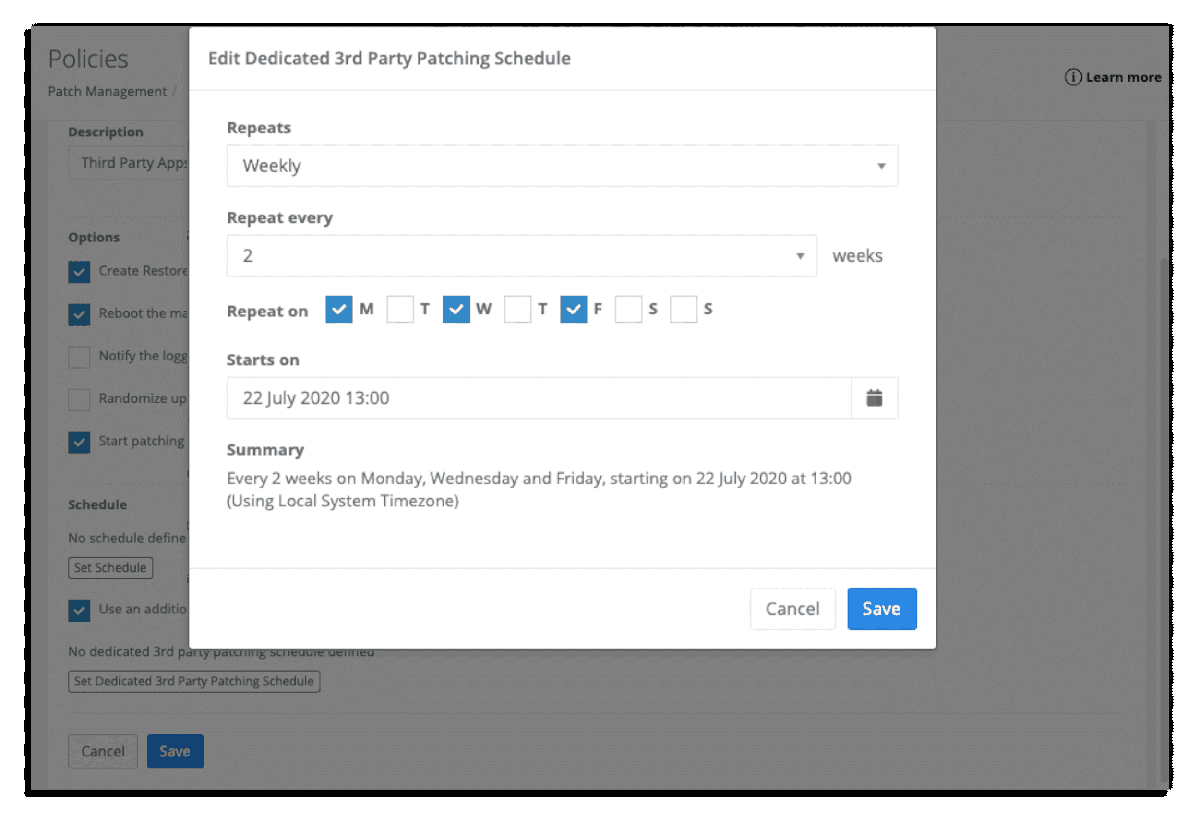
Patch management
Vital for stability and security, patch management automates software updates. It identifies, tests, and applies patches, keeping systems current. Regular patching minimizes vulnerabilities and risks, enhancing performance and reliability. This proactive approach strengthens server infrastructure, letting businesses focus on core operations securely.
How to choose the best server management software for your business
There are several important considerations in selecting the ideal server management solution tailored to your specific business needs, including assessing your requirements, considering your industry, planning for scalability, and factoring in security.
1. Assess your requirements
To choose the best server management software for your business, start by assessing your specific requirements. Analyze your company’s size, scope, and operational needs.
Are you a small startup or a large enterprise? Do you work with on-premise servers or remote endpoints? Understanding these factors helps pinpoint relevant functionalities. Matching software capabilities with your needs streamlines operations and offers concrete benefits.
2. Consider industry-specific needs
Industries have unique challenges and compliance rules. When picking server management software, consider if the options suit your industry’s demands.
For healthcare, prioritize strong security and HIPAA compliance. Finance might need robust encryption and auditing. Software aligning with your industry ensures meeting regulations and securing sensitive data.
3. Scalability and future growth
While current needs are paramount, don’t forget about the future. As your business expands, so do your IT requirements. Choose software that scales with your growth, avoiding disruptions or overhauls. Scalable solutions guarantee smooth transitions during expansion, saving the trouble of searching for new software whenever your organization changes.
4. Security considerations
Security features are crucial in server management software. Check if it has encryption for data safety, robust access controls, and regular vulnerability assessments. Strong security features shield sensitive data against evolving cyber risks.
5. Trial and testing
Regardless of how features look on paper, real experience matters. Utilize trial periods offered by software vendors. Your IT team can interact with the software, explore features, and assess compatibility with workflows. Testing deepens understanding, identifies challenges, and leads to informed decisions for successful implementation.
How we evaluated server management software
In our evaluation of top server management software, we categorized key subcriteria into five weighted categories. This subcriteria determined category scores for each listed software, resulting in overall scores.
The server management platforms with the highest overall scores earned a spot on our list, while the evaluation also identified primary use cases for the selected software.
Core features – 35%
We rigorously assessed the leading six server management software options by thoroughly examining their core features. This critical evaluation held a substantial weight of 35% in our criteria. To comprehensively gauge the software’s capabilities, we used the following subcriteria as benchmarks:
- Server monitoring: We scrutinized the software’s capacity to monitor server health, uptime, and performance. Effective monitoring ensures timely issue detection and resolution, contributing to seamless operations.
- Resource allocation: We evaluated how adeptly the software optimized resource allocation, such as CPU, memory, and storage. Efficient allocation prevents bottlenecks, resulting in optimal server performance.
- Security management: We scrutinized the software’s security provisions, including access controls, encryption, and vulnerability assessments. Comprehensive security safeguards data integrity and confidentiality.
- Remote access: We assessed the software’s remote access capabilities, determining its ease of use and security. Robust remote access enhances troubleshooting and configuration tasks from various locations.
- Scaling and load balancing: We examined the software’s capacity to scale resources and distribute workloads efficiently. At the very least, the software should be able to monitor this information. Scalability ensures adaptability to evolving demands, maintaining consistent performance.
- Patch management: We evaluated how well the software handled software updates and patches. Effective patch management mitigates vulnerabilities, enhancing system stability and security.
- User management: We analyzed the software’s user management features, assessing how it facilitated user access and permissions. User management tools contribute to a secure and organized environment.
- Automated backups: We scrutinized the software’s automated backup capabilities, focusing on its ability to safeguard critical data through routine backups.
- Alerts and notifications: We assessed the software’s alerting and notification mechanisms for timely issue identification, ensuring administrators are promptly informed about critical events.
Cost – 30%
We assigned considerable significance to cost, which was weighted at 30%. This holds substantial importance as it enables businesses to make informed decisions that align with their budgetary considerations. In our assessment of this criterion, we meticulously analyzed a set of specific subcriteria to ensure a holistic understanding of the software’s pricing model and options.
- Cost transparency: The availability of pricing details directly on the website facilitates quick and straightforward decision-making for businesses, eliminating the need for prolonged inquiries or negotiations.
- Sales contact availability: We assessed how easily potential clients could reach out to the software’s sales team for pricing-related queries. This accessibility underscores the commitment of software providers to clear and responsive communication.
- Billing flexibility: We scrutinized the availability of different billing options, specifically focusing on whether the software offered both monthly and annual billing alternatives. This flexibility accommodates varying financial strategies and preferences of businesses, allowing them to choose a payment structure that best suits their needs.
- Product tiers: We also took into consideration customizable product tiers, ensuring that businesses could tailor the software’s offerings to match their specific requirements, thereby optimizing their investment.
- Free trial: Finally, we examined whether the software provided a free trial period, enabling businesses to experience the software’s functionalities firsthand before committing.
Customer support – 15%
We dedicated a weight of 15% to assessing the quality of customer support provided by the software vendors. Robust customer support ensures that businesses receive timely assistance and guidance throughout their usage of the software.
To comprehensively gauge this criterion, we examined several subcriteria that collectively shed light on the effectiveness of customer support avenues:
- Live chat: We evaluated the availability and responsiveness of live chat support, assessing how promptly vendors addressed user queries and concerns in real-time.
- Phone support: We scrutinized the availability of phone support, emphasizing the importance of direct communication channels for businesses seeking immediate assistance.
- Email support: The responsiveness and effectiveness of email support were also assessed, considering how effectively vendors addressed queries sent via email, providing a written record of interactions.
- Forums: We explored the presence of user forums or online communities, which contribute to peer-to-peer support and a platform for users to share experiences and solutions.
- Documentation: Comprehensive and accessible documentation was another focal point, as well-structured guides and manuals empower users to troubleshoot issues independently.
Ease of use – 10%
A 10% weight was assigned to assessing the software’s ease of use, a factor pivotal in determining its compatibility with existing workflows. This evaluation facet takes into account two vital subcriteria:
- Setup: We meticulously analyzed the software’s installation and setup processes to gauge their simplicity and user-friendliness. A streamlined installation experience ensures that businesses can swiftly integrate the software into their systems, minimizing any disruptions and complexities.
- Management and UI: We assessed how intuitively businesses could navigate the software’s interface to effectively manage server settings, resource allocation, and routine tasks. This emphasis on ease of management ensures that businesses can optimize their server operations without unnecessary challenges.
Frequently Asked Questions (FAQs)
What is server management software?
Server management software is an essential tool for efficiently overseeing a range of server types, including web, application, database, file, and email servers. It caters to system administrators, developers, and hosting providers, streamlining the management of server infrastructure. Key functionalities encompass:
- Server monitoring: Tracking server health indicators like CPU and memory usage, disk space, and network activity.
- Configuration management: Handling configurations, software updates, installations, and security settings.
- Automation: Streamlining tasks like backups, software deployment, and server provisioning through automation.
- Security management: Enforcing access control, firewall settings, and intrusion detection to enhance security.
- Resource optimization: Efficiently managing server resources to ensure optimal utilization and minimize downtime.
- Troubleshooting and diagnostics: Identifying and resolving server issues, diagnosing performance bottlenecks, and generating insightful reports.
What are the benefits of server management software?
Server management software offers benefits such as resource optimization for cost reduction and efficiency improvement. Capabilities like task automation saves time and reduces the likelihood of errors.
Additionally, the software enables centralized control, making server management simpler and more effective. Enhanced security measures guard against unauthorized access and malware threats. It supports scalability, allowing for seamless infrastructure expansion.
Is there open-source server management software?
Yes, open-source server management software is available in the market.
Open-source software is freely accessible and can be modified and distributed by users. It offers benefits such as enhanced security through community code review, customization to meet specific needs, cost savings by avoiding licensing fees, and robust community-driven support from developers and users, but it does require advanced technical ability to configure and take advantage of all its features.
One strong example of an open-source server management tool is ISPmanager.
Bottom line: Choosing the best server management software for your business
From comprehensive monitoring and resource allocation to automation and security measures, the top-tier server management software options explored here offer a range of features to meet diverse operational needs. By assessing factors such as ease of use, cost transparency, customer support, and industry-specific requirements, businesses can make informed decisions to ensure seamless server management and sustained growth.
As technology continues to evolve, the careful consideration of these software solutions remains pivotal in elevating efficiency, security, and overall performance in the dynamic landscape of modern IT operations.
Don’t skimp on security! Once your server management plan is in place, make sure you protect it with one of the best server security tools on the market.