


I am
going to run a brief series of articles stepping through some of the more common
administrative tools that a Windows 2000 administrator might have to use.
Although some of the articles might seem trivial to you, it’s probably only because
you have high exposure to these tools on a day-to-day basis. For
some of the younger folks and newer admins, this information should prove quite
useful. And, for you older folks, maybe you’ll pick up a thing or
two.
I am going to run a brief series of articles stepping through some of the more common administrative tools that a Windows 2000 administrator might have to use. Although some of the articles might seem trivial to you, it’s probably only because you have high exposure to these tools on a day-to-day basis. For some of the younger folks and newer admins, this information should prove quite useful. And, for you older folks, maybe you’ll pick up a thing or two.
So, the
first tool I am going to discuss is one of the most fundamental tools that we
use in any Server (or workstation for that matter) troubleshooting
situation. This tool is the Performance Monitor.
The Performance Monitor
is accessed in Windows 2000 though the Control Panel’s Administrative Tools
icon. When you click on “Performance” you will be presented with
the MMC for the Performance Monitor. It looks like the following:
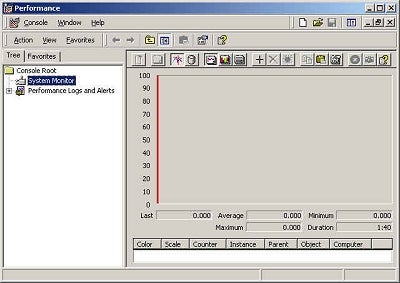
To do any
work within this tool, you must be in the right side of the window, the active
side. If you want to add counters to the live view of your machine, simply
right click and select “Add Counters”. You will be presented with the following:
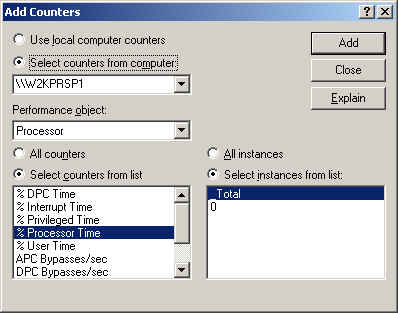
From
here, you can select what counters you would like to view and from where.
Be careful not to add too many, or viewing real time will prove cumbersome.
You can
also build a template for monitoring machines in your environment via this
tool. If you collect a set of Counters that you would like to set as your
standard, you can right click, drop to Save As, and save these as an HTM
template. With NT, you would be saving them as a PML or something of that
format.
To
collect logging information from that template or just to monitor logging of
Performance data at all, you would select Performance Logs and Alerts from the
left side of your screen. There is an example of a performance monitor log
that you can start and stop to see the effects. You can have this log
information piped to a BLG file, a CSV, or basically any format that you would like
to collect in.
You can
also schedule the stopping and starting of logging by dropping to
“Properties” of a log. Here, you will be able to input a stop
and start time. This can be handy if you are having recurring problems on
a server during a weekend rollout or something like that. You would not
want to collect data from 48 hours if you only need 12 hours worth…
You can
import and view data from these logs as if you were viewing your own active
information (only it will be a static view). You can actually pick and
choose which counters you want to view from the logged data the same way you
would choose from active performance views (as described above).
I hope
this information helps some of you along. Let me know if you have a tool
that you would like me to explain in an article.