The 11th Global Data Center Survey is here with insights from international data center operators and owners on the latest trends for managing servers.

The Uptime Institute’s (UI) annual survey is a critical reference point for the state of data centers, and the 2021 report is no different. The survey covers a range of topics, including PUE metrics, outage trends, sustainability efforts, and supply chain disruptions. UI researchers offered the results of this year with additional context from developing news and responses from previous years.
Here, we look at what stood out in the survey results, and what organizations need to keep in mind moving forward.
See the full results of the Uptime Institute Data Center Industry Survey Results 2021.
Building Out Sustainability
Across industries, sustainability initiatives receive increasing attention from stakeholders that seek to ensure organizations take their environmental footprint seriously. Data centers aren’t innocent, and this year’s results show there’s still a long road to eco-friendly practices being universal.
Metrics Tracked
For sustainability purposes, 82% of respondents track IT or data center power consumption (electricity). Power usage effectiveness (PUE) comes in second, with 70% of data centers reportedly calculating facility efficiency, while only 40% track server utilization.
Lacking the Basics
UI researchers point to immaturity in the data center industry when it comes to regular sustainability practices like tracking emissions (33%) and equipment disposal (25%). Server utilization alone is worth adding to any organization’s reporting.
51% Don’t Track Water Usage
Despite a heavy reliance on water globally for data centers, only 51% of respondents currently track water usage — almost two-thirds of organizations said no point to the lack of justification. External pressure may soon change that.
The Word on Outages
Every year, the Uptime Institute asks respondents to report the number of and seriousness of outages within the last three years. This year’s results show outages may be gradually declining, but the consequences remain severe to the victim organization.
Number of Outages Decreasing
AAs availability is most operator’s’ number one priority;, the good news is that outages continue to decrease as systems and processes become more reliable. When asked to classify their most significant outage, 31% of respondents cited they had no such instance – up from 22% in 2020. UI researchers note these recent improvements may be owed to pandemic-induced effects.
Data centers that follow best practices invest in implementing processes and training personnel to experience fewer outages. Human error and management play their part as well. When asked, 79% of respondents confirmed human error was involved in an outage. Similarly, 76% stated the outage was preventable with better management, processes, or configuration.
What’s Causing Outages?
The causes of outages remained consistent from 2020, with on-site power (electricity) leading the pack and jumping from 37% to 43% of failures. With 14% of outages each, the next three leading causes relate to network issues, cooling failures, or software and IT systems errors.
Though they remain rare, outages owed to SaaS hosting, cybersecurity, and third-party cloud providers went from 7% to 11%.
Read more: Using Zero Trust Security to Protect Applications and Databases
Outage Consequences Remain Severe
Though outages have been on the decline, outage consequences are just as severe. From 2019, there was no change in the percentage of severe cases (8%). Notably, over half of all service interruptions are managed effectively without much pain (56%), which means the remaining half fall into the severe, serious, and significant categories.
Though outages have always led to lost revenue, time, resources, and possibly reputational damage, they’re also becoming costlier. From 2019, the instances where the total cost of downtime was under $100k dropped from 60% to 39%. At the same time, examples of outage costs of $100k up to $1 million jumped to 47%, — meaning just under half of all outages cost organizations hundreds of thousands of dollars.
Are Data Center Skills Vulnerable to AI?
As data centers expand and grow more complex, a fifth of respondents point to a lack of qualified staff. Nearly half confirmed difficulty finding qualified candidates (47%), and almost a third confirmed difficulty retaining staff (32%).
While artificial intelligence can improve processes and reduce human error in data centers, respondents overwhelmingly believe this is years away. Over half of respondents stated they’d trust an AI system with adequate training to make operational decisions.
Read more: On-Premises is Here to Stay. But Which Workloads Go Where?
Supply Chain Disruptions
Technological Disruptions
Recent years have seen the rapid expansion of data center capacity while the global economy faces an ongoing pandemic, supply chain instability, and innovations.
From the global chip shortage to the rising power of cloud and internet service providers, most respondents communicated some expectation of supply chain problems in the next two years. Facilities with hyperscale capabilities (think 20 MW or more) continue to outweigh the needs of smaller facilities, further pushing out smaller data center vendors.
Survey results for suppliers show over half believe large data centers will influence design and supply chain decisions in the next three to five years. This could signal danger for traditional equipment vendors.
Read more: IBM 2nm Breakthrough: Chip and Server Implications
Cloud and Internet Services as Disruptors
Cloud and public internet-based applications continue to draw workloads away from traditional data centers. Without stronger accountability from cloud providers’ platforms, organizations at large must be vigilant in assessing their supplier’s vulnerability posture.
While mission-critical workloads largely remain off cloud segments, a growing number (57%) of administrators are already doing so, open to the possibility, or plan on making the shift with more visibility.
“63% of suppliers say that in the next three to five years, large cloud and internet companies will likely restrict or reduce competition among equipment suppliers.“
Rack Density Continues to Rise
As racks become more dense, administrators must reevaluate layout, cooling, and power distribution. The UI survey asked how respondents’ largest data center is doing in 2021, and results show this trend continues gradually, with most server cabinets still well under 10 kW each.
Read more: Power Consumption: The Battle Between Demand and Efficiency
Looking at PUE as an indicator, the operators’ most prominent data centers’ average annual PUE (1.57) continues to drop. Low-density racks of 5kW still suffer from higher PUEs, partly because these data centers were built before recent advancements. Low-density racks are a rarity for data centers with PUEs below 1.3, while over a third is above 10 kW.
Ultimately, more extensive data centers — typically containing some high-density cabinets — must prepare to either shift to direct liquid cooling or deliver large volumes of cold air to maintain these racks.
2021 Uptime Institute Global Data Center Survey

What Is the Uptime Institute?
The Uptime Institute (UI) has been an independent advisory and think tank devoted to “improving the performance, efficiency, and reliability of business-critical infrastructure through innovation, collaboration, and independent performance certifications.”
UI is globally known for its vendor-neutral research and creation and management of its Tier Standards & Certifications for Data Centers. In all, the firm has issued more than 2,500 Tier Certifications in over 110 countries since 1993.
What Is the Global Data Center Survey?
This year’s Global Data Center Survey is the eleventh time the Uptime Institute released its findings on developments and trends in the data center universe. Leaning on its global network of data center administrators, UI surveys hundreds of stakeholders in dozens of countries to complete its annual report. Previous survey findings can be accessed here.
The 2021 Uptime Institute Global Data Center Survey split respondents into two groups:
- Data center owners and operators
- Data center suppliers, designers, and advisors
This report focused on responses from data center owners and operators, and UI intends to publish a second report later in 2021 on suppliers, designers, and advisors.
Survey Respondents: Data Center Owners & Operators
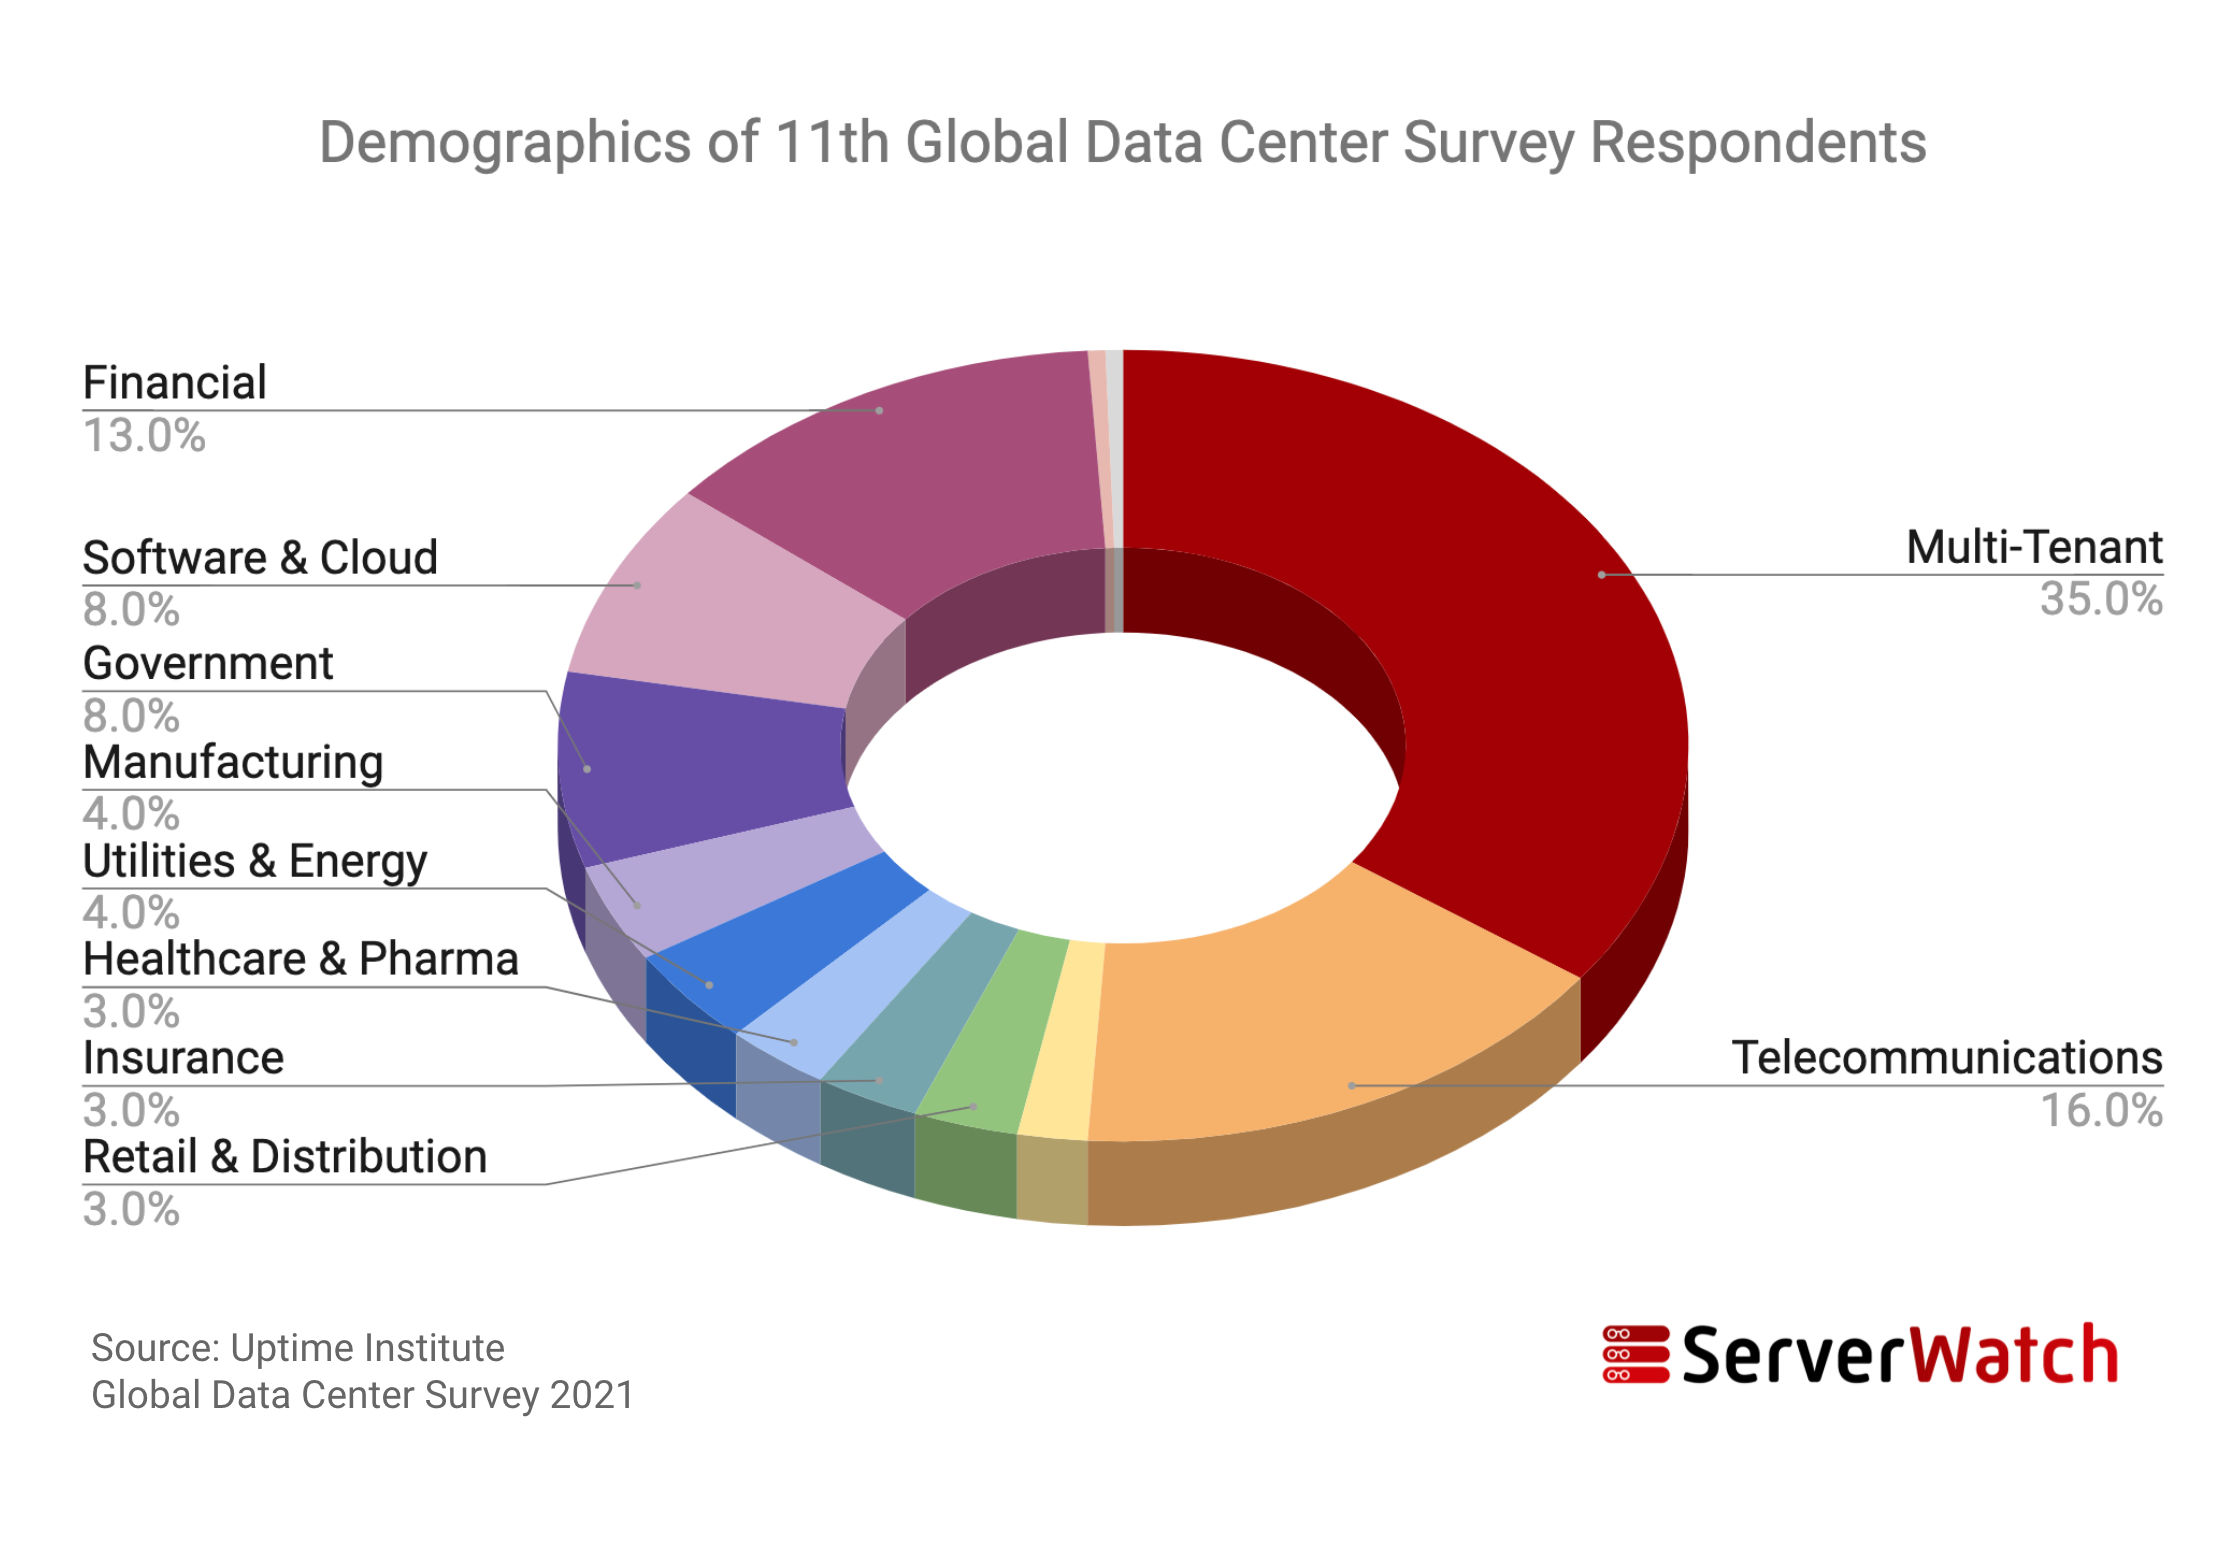
Just over 800 end users represented every region of the globe registered for this year’s survey. UI authors broke down the demographics of respondents by region, job function, and industry.
Respondents by Industry

Respondents By Region
| Region | Survey |
|---|---|
| U.S. and Canada | 25% |
| Europe | 23% |
| Asia-Pacific | 16% |
| Latin America | 15% |
| Africa | 8% |
| Middle East | 6% |
| China | 5% |
| Russia and CIS | 2% |
Respondents by Job Function
| Job Function | Survey |
|---|---|
| Critical facilities | 41% |
| Senior executives | 26% |
| IT managers | 16% |
| Design engineers | 16% |

