atop is a useful tool that displays system load information alongside
process information in a similar style to top.
Tip of the Trade: Atop makes it easy to keep on top of system monitoring. This useful tool displays system load information alongside process information in a style similar to top.
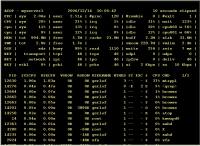
As in the screenshot below illustrates, the top window shows system-level information and the bottom one process information.
 |
| Atop in Action |
The lines in the top window show:
- PRC: Total CPU time in system and user mode, total number of processes
and of zombie processes, and the number of processes that exited during the
polling interval. The default polling interval is
10 seconds. Use ‘i’ to change it interactively or ‘z’ to pause it. - CPU and CPL: CPU utilization and load (averaged over 1, 5 and 15
minutes). - MEM and SWP: Amount of memory and swap space that is available and
where it’s allocated. vmcom and vmlim show how
much virtual memory space is committed and what the limit is. - DSK: disk utilization. avio shows the average number of
milliseconds per request. - NET: Network utilization for the TCP layer (“transport”), the
IP layer (“network”) and each interface.
All of these use color to indicate if there are
any problems.
The bottom window shows active processes (use ‘a’ to toggle showing all
processes). ‘g’ shows the default process information, or use ‘m’ to show
memory information. VGROW and RGROW on the memory information screen show the
increase in virtual and memory usage during the polling interval; check the
man page for further information about other columns. Note that you can also
kill a process from here by hitting ‘k’.
There are various other top-alike programs out there for other resources.
Try iftop, for example, to take a look at your network interface
statistics! Or htop to get top information in colour and
with scrolling.

