


Gaining insight into the performance of complex systems has always proved a major challenge for IT administrators. Before now, system administrators needed to wait for feedback from software users to understand key performance metrics before deciding what needed to be done to improve and sustain great system performance.
However, digital transformation has brought tools designed to automate the monitoring and management of complex system infrastructure. These tools are commonly referred to as observability tools.
With observability in place, organizations can gain a better insight into the internal state of their entire infrastructure at any time. Observability tools also provide access to more accurate data on the IT system environment. To choose the right observability tool, organizations should keep their unique infrastructure needs in mind when evaluating the top solutions.
Top Observability Tools in 2022
1. AppDynamics
AppDynamics is one of the top-rated observability tools from Cisco. The tool provides real-time visibility into all layers of the application infrastructure, allowing IT teams to understand the main causes of poor application performance.
AppDynamics may also display infrastructure elements, correlate performance with important business data, and find security flaws in application code. The platform can depict the interaction between a company’s customers and operations.
Furthermore, AppDynamics prioritizes the most important component of your business performance, which helps you to take action in real time. Because this platform offers a deep connection between key system performance and business metrics, development teams can make software products more profitable by resolving key issues that may impact the business overall.
In addition, AppDynamics also comes with features that allow for plugins or extensions, which aid the quick collection of telemetric data and ensure that these data are pushed to a central system or controller.
2. Datadog
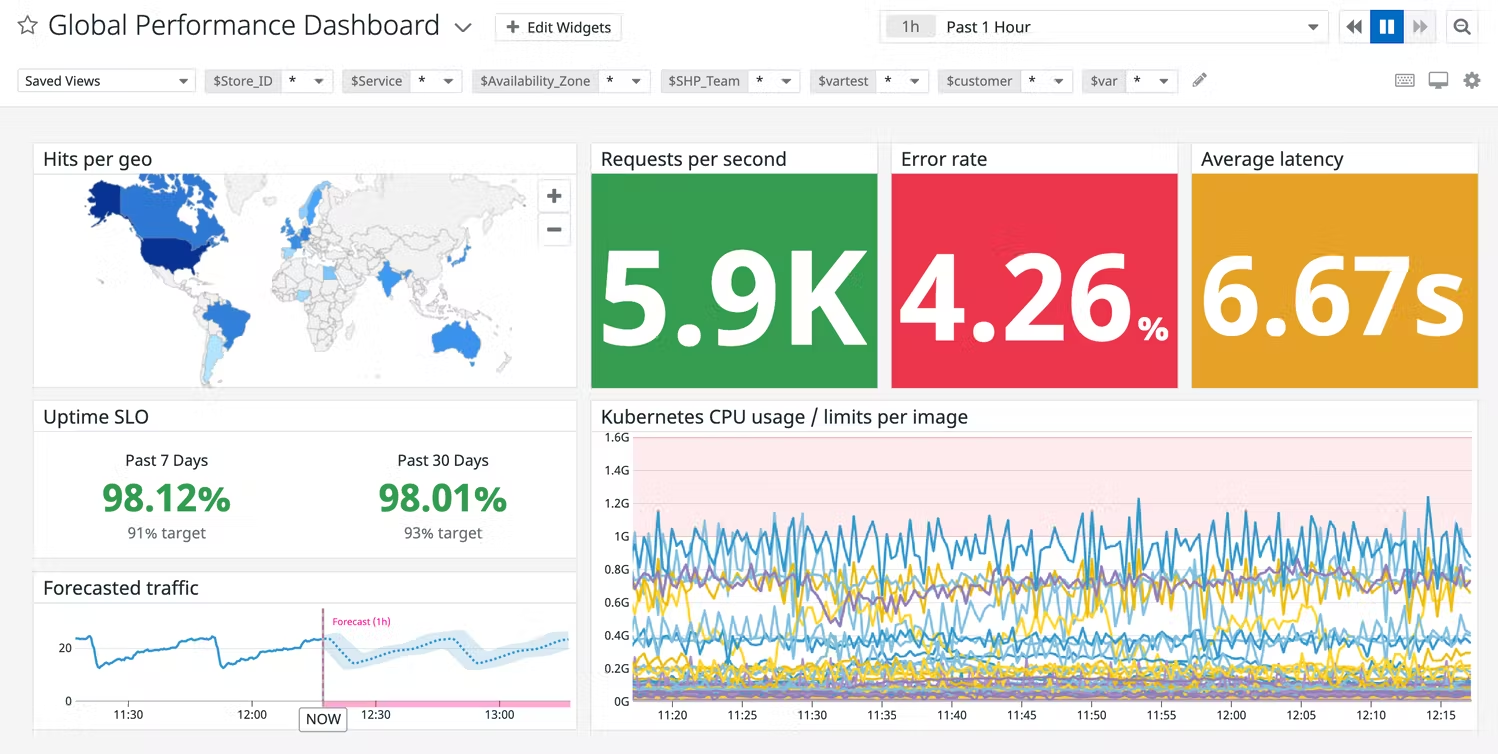
Datadog‘s observability tool has a built-in support capability that integrates with more than 500 third-party extensions. Datadog’s SaaS-based infrastructure monitoring provides metrics, infographics, and alerting capabilities to help DevOps teams optimize cloud or hybrid environments. With Datadog, users can track and troubleshoot errors with just a click and view historical data on previously used infrastructure.
This observability platform also enhances team collaboration and troubleshooting with comprehensive coverage of popular technologies, a straightforward setup process requiring little maintenance, and an intuitive interface.
The platform also offers complete coverage of any stack, allowing users to deploy the tool in hybrid, on-premise, IoT, and multi-cloud environments. Users can gain access to vendor-backed integration with serverless platforms and containers like Kubernetes.
3. Dynatrace
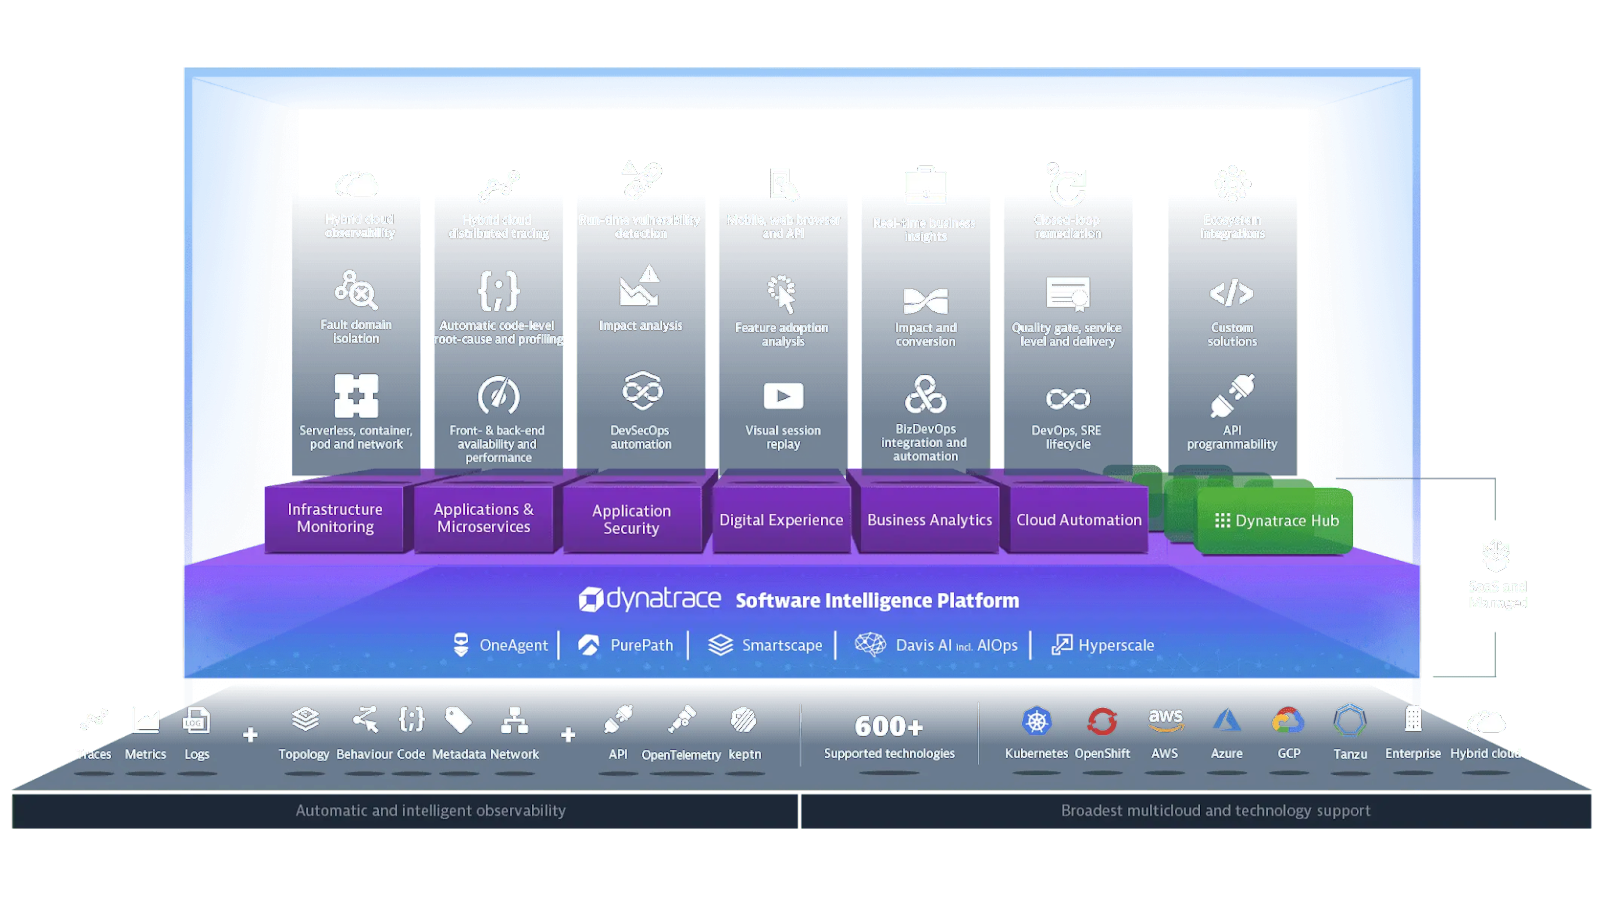
Dynatrace provides well-rounded infrastructure monitoring that leverages AIOps to simplify and automate cloud operations and DevSecOps. Dynatrace also features the capacity to integrate seamlessly with multiple technologies.
This service can provide observability into networks, mobile apps, server-side services, and other infrastructure. The platform has an AI-driven causation engine that provides root cause analysis and analyzes how well users engage with applications.
In addition, since Dynatrace is based on open standards and supports more than 600 third-party technologies, businesses can add functionality to the platform by utilizing its API, SDK, or plugins.
With this tool, DevOps teams can innovate faster and automate the overall quality of SDLC. The tool can also help system administrators to predict and resolve issues even before they affect performance.
4. Grafana Cloud
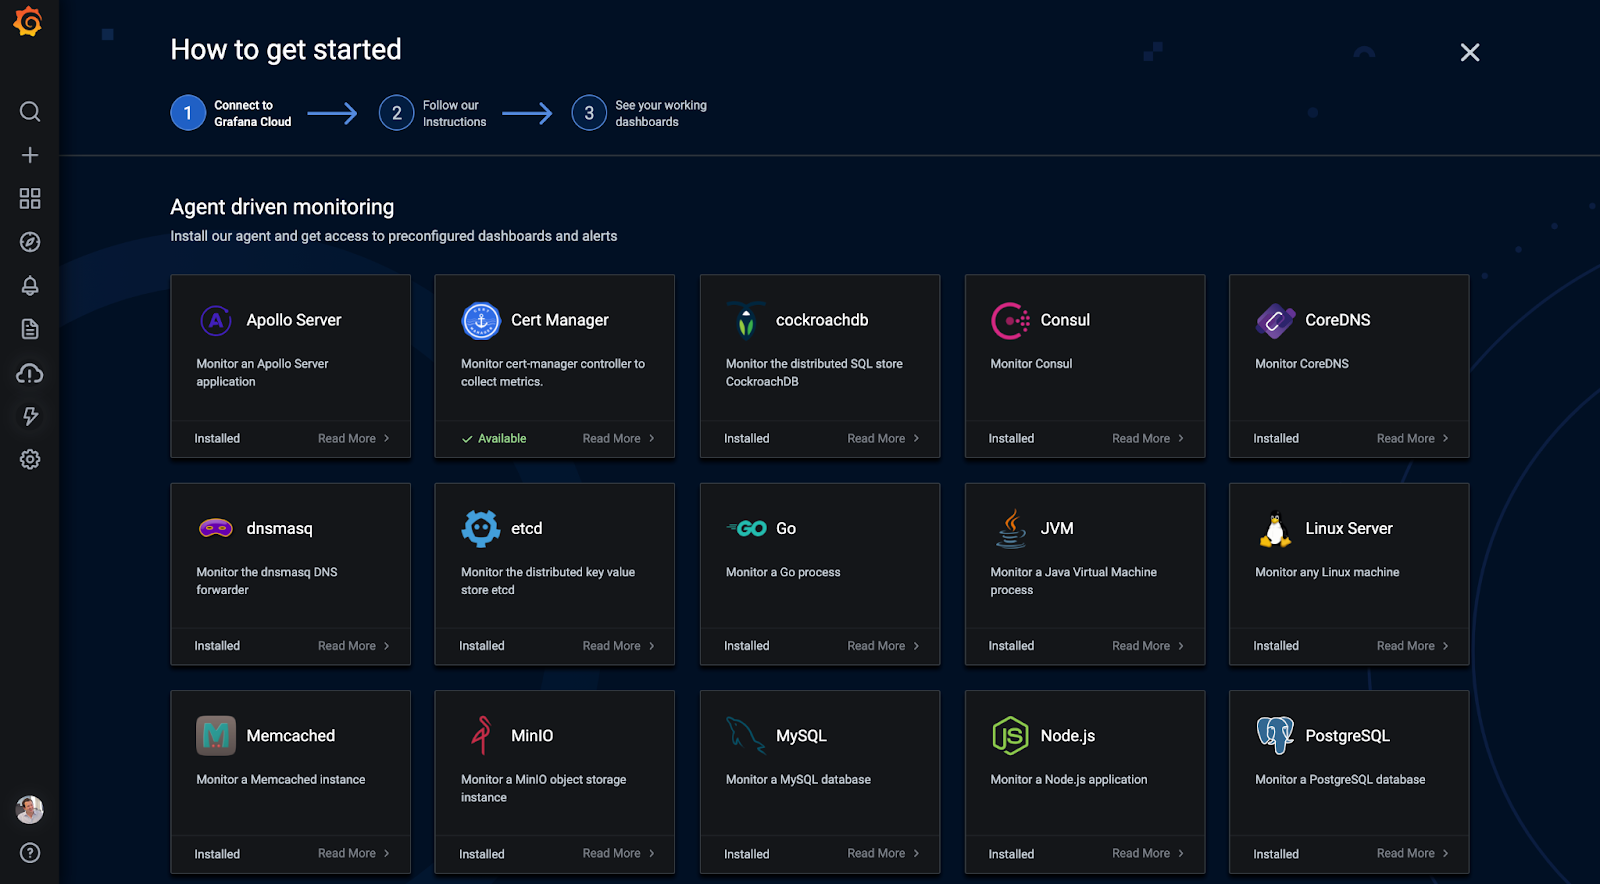
Grafana integrates popular open-source technologies to provide an intelligent observability platform with deep analytics and interactive visualization into application infrastructure. As a result, users can easily switch between logs, metrics, and correlated data to get the root cause of issues in their system infrastructure.
Grafana also provides users with a scalable set of native integrations that help provide fast results. For example, users can start monitoring major infrastructure elements such as Postgres, MySQL, Memcache, and Redis with just a few clicks. Users can also choose from preconfigured dashboards to gather vital logs and other insights.
Another advantage of Grafana is that the platform offers tools for creating meaningful graphs and visualizations from time series database data. Users can also build a sophisticated set of dashboards from a central interface that shows telemetric data from numerous sources, including Kubernetes clusters, numerous cloud services, Raspberry Pi devices, and services like Google Sheets.
5. Splunk
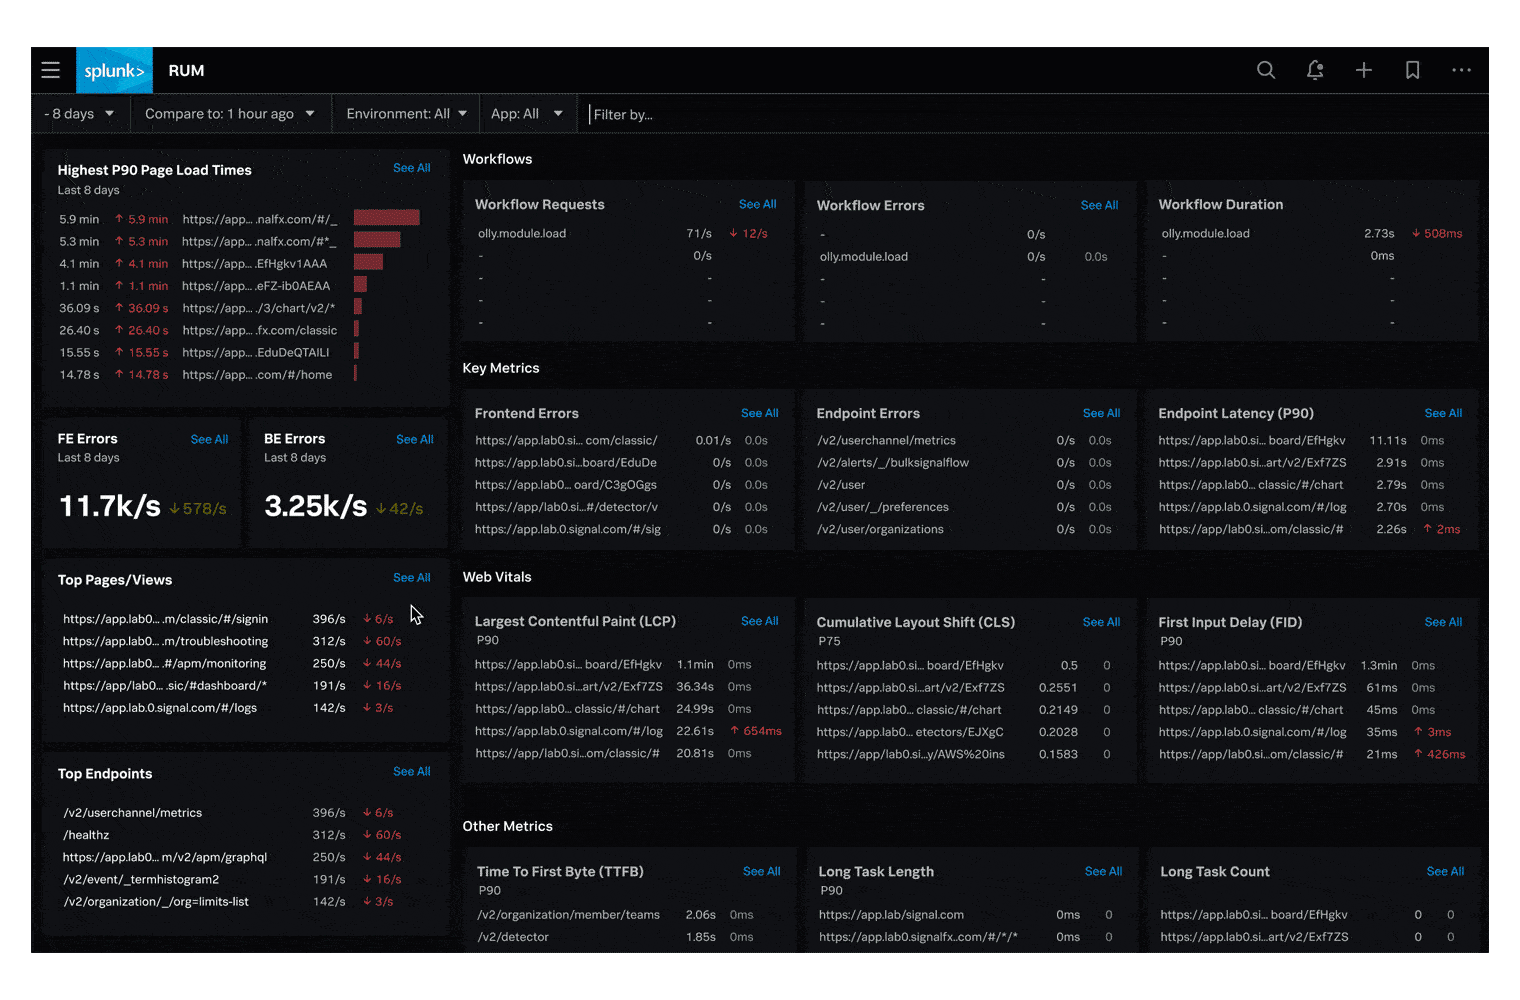
Splunk provides extensive security and full-stack observability with multiple customization options. Regardless of whether you’re operating an on-premise, hybrid, or muti-cloud infrastructure, Splunk comes with features that put you on notice when there is a problem in your system.
Splunk observability capability helps DevOps teams eliminate data silos and monitoring guesswork. It also helps predict potential problems in applications and infrastructures before users notice. It also offers simplified troubleshooting and end-to-end visibility across the technology stack.
Splunk can provide telemetry data from across the full technology landscape, including multi-cloud, hybrid cloud, and edge settings. It supports more than 2,400 Splunkbase apps and add-ons, plus built-in orchestration and automation features.
6. Lightstep
Lightstep is a unified observability platform that allows enterprises access to real-time insights into mobile, backend, and cloud infrastructures. Data from large-scale operations involving millions of devices, users, and clients can be aggregated for streamlined analysis.
The platform automatically detects changes to apps, infrastructure, and user experience and can offer information on their causes. Additionally, it provides sophisticated troubleshooting abilities, such as structured views of the investigative steps needed to resolve system errors.
In terms of coverage, Lightstep covers visibility into system infrastructures, runtimes, and other third-party services. Plus, it integrates easily with a wide range of frameworks and platforms.
7. New Relic
New Relic‘s observability platform comprises several technologies that offer full-stack infrastructure and application monitoring.
Some of the components covered by this observability platform include mobile, network, Kubernetes, browsers, and synthetic monitoring. Additionally, the platform features log management, error monitoring, and CodeStream integration, which provides a platform for developer collaboration.
New Relic also leverages applied intelligence to provide insights automatically into an incident’s fundamental causes and connects with more than 470 third-party solutions. As a result, IT administrators can worry less about successfully integrating their third-party platforms.
What are observability tools?
An observability tool is a system monitoring tool used to analyze and monitor application behavior. Observability tools are used to ensure that all the infrastructures that support application delivery are performing optimally, giving insight into what is happening across the entire system.
Without observability tools, it becomes more difficult to understand and monitor the core system’s performance metrics such as bandwidth usage, memory usage, HTTP requests, and other events occurring within a system.
Components of an observability tool
There are three main features every observability tool should offer to DevOps engineers: metrics, logs, and traces.
Metrics
Observability tools provide a set of metrics monitored over time. Metrics include key performance indicators (KPIs), CPU capacity, memory, and any other evaluation of a system’s health and performance. Understanding how performance evolves over time enables IT teams to improve the user experience.
Logs
The most effective method to determine what’s wrong with a system may be to examine its log. Logs provide a record of events within a system. They might be in binary or plain text format and are time-stamped. There are also structured logs, which combine text and metadata and are typically simpler to query.
Traces
Observability tools feature a trace to follow a user request until it has been fulfilled. Every action taken in response to the request is documented as part of the trace. In a complex system, a single request may go through multiple microservices; therefore, traces are crucial for identifying process failure points and system bottlenecks.
What are the key benefits of observability?
Observability practices offer a lot of benefits to IT administrators and DevOps developers. Two of the biggest benefits of observability are more efficient workflows and thorough visibility.
Efficient workflows
Observability makes it possible for developers to track the progress of a system from beginning to end. These tools allow access to specific data pertaining to a particular problem. This facilitates faster application analysis and debugging, which boosts efficiency.
Thorough visibility
Due to the size of distributed systems, IT teams frequently have difficulty determining the answers to several critical questions. These include:
- Which services are in use
- Whether application performance is satisfactory
- Who owns a particular service
- How the system appeared before the most recent deployment
Observability tools provide widespread, real-time visibility into production systems, which helps IT teams answer these questions and avoid any related obstacles.
Choosing the best observability tool
There are some important guidelines every organization should consider when shopping for the right observability platform.
User experience
The right observability tool should be easy to manage and deploy. The platform should be able to produce alerts and notifications to make sure that crucial information reaches the appropriate parties as soon as possible. Additionally, an intuitive user interface should make automating processes a simple endeavor regardless of how big or skilled the IT team is.
Technical support
There is no guarantee that an organization’s developers or engineers won’t run into hitches when using an observability tool. Hence, easy-to-reach technical support should be a top priority.
Integrations
The success of an observability platform is directly tied to its integration abilities. The right solution should be able to support and integrate with many frameworks, programming languages, and tools that the organization uses.