


Performance
A familiar tool still exists in Windows 2000 for monitoring performance, although it now carries a new name. The Performance tool is actually a combination of two different MMC snap-ins: System Monitor, and Performance Logs and Alerts. Combined, they essentially form Performance Monitor from NT 4.
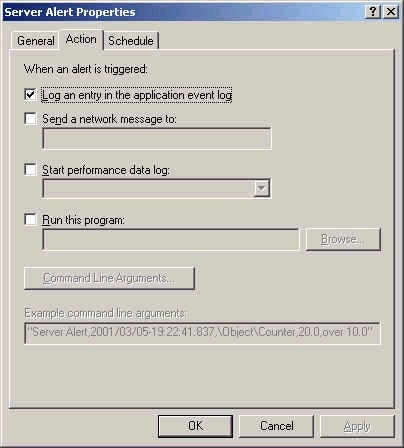
Performance Monitor Logs and Alerts allows you to configure both logs (which collect information on performance counters you specify) and alerts (which allow you to specify a course of action once the thresholds you define are reached). A log records data over a period of time, and is usually used for analysis purposes, such as tracking resource usage trends and creating baseline measurements. You can later import this logged data into a spreadsheet or the System Monitor program for analysis. Two types of logs exist: Counter logs and Trace logs. A Counter log measures object performance counters at defined intervals. A Trace log is mostly used for debugging or error tracking, and records data only when certain errors (such as a page fault) occur. Note that running logs appear with a green icon, and that stopped logs appear in red. Alerts can also be configured according to when a certain threshold is reached. For example, you could set an alert to be triggered when processor utilization exceeds 80 percent. Further to this, you can control what happens when the alert is triggered, as outlined below:
The System Monitor element of the Performance tool allows you to track performance counters for different system objects such as memory, CPU, network, and many others. System Monitor can display in graph, histogram (a moving bar chart), and report formats. Of course, it is not practical to know all the counters, but there are a few that are more important than others. These are listed below according to the type of object.
Disk Counters
Before we look at the counters, remember that disk counters cannot be gathered until you run the
Diskperf -y command. Each of the counters listed below have corresponding counters on the LogicalDisk object. The difference is that LogicalDisk is for a volume, while PhysicalDisk is for an entire hard disk.
PhysicalDisk: Current Disk Queue Length – measures the number of requests waiting for disk access. A value higher than 2 suggests a bottleneck.
PhysicalDisk: Disk Bytes / Transfer – Average number of bytes transferred between memory and disk during reads and writes. Values around 4K can suggest a high level of paging.
PhysicalDisk: %Disk Time – Percentage of time that a disk is busy handing read or write operations. Higher values suggest a disk bottleneck.
Processor Counters
Processor: % Processor Time – Percentage of time that the Processor is busy handling threads. Acceptable values will depend upon the specifications of the system, but a value above 80% suggests a bottleneck.
Processor: Interrupts/sec – Average number of times per second that a device interrupts the CPU. This must be compared versus baseline measurements to determine a problem. A very high value usually suggests malfunctioning hardware.
System: Processor Queue Length – Number of threads waiting for access to the CPU. In a single processor system, a value of 2 or higher suggests a bottleneck.
Network Counters
NetworkInterface: Total Bytes/sec – Measures the total amount of inbound and outbound traffic passed though the network interface. Acceptable values are determined by the maximum of the media (like Ethernet) in use. When value approaches the card maximum, it may be time to upgrade to a faster or multiple adapters.
NetworkInterface: Output Queue Length – Number of packets that are queued waiting for access to the media. Values higher than 2 suggest a bottleneck.
Memory Counters
Memory: Available Bytes – Number of byte of memory available at any given point in time. A value of less than 4K suggests the need for additional memory.
Memory: Pages/sec – The number of times per second that data is transferred between RAM and the paging file. If this value is much higher than the baseline measurement, it suggests the need for additional RAM.
Memory: Page Faults/sec – How often a needed memory page is not found in RAM and must be swapped in from the page file. Again, high values above those observed in the baseline suggest the need for more RAM.